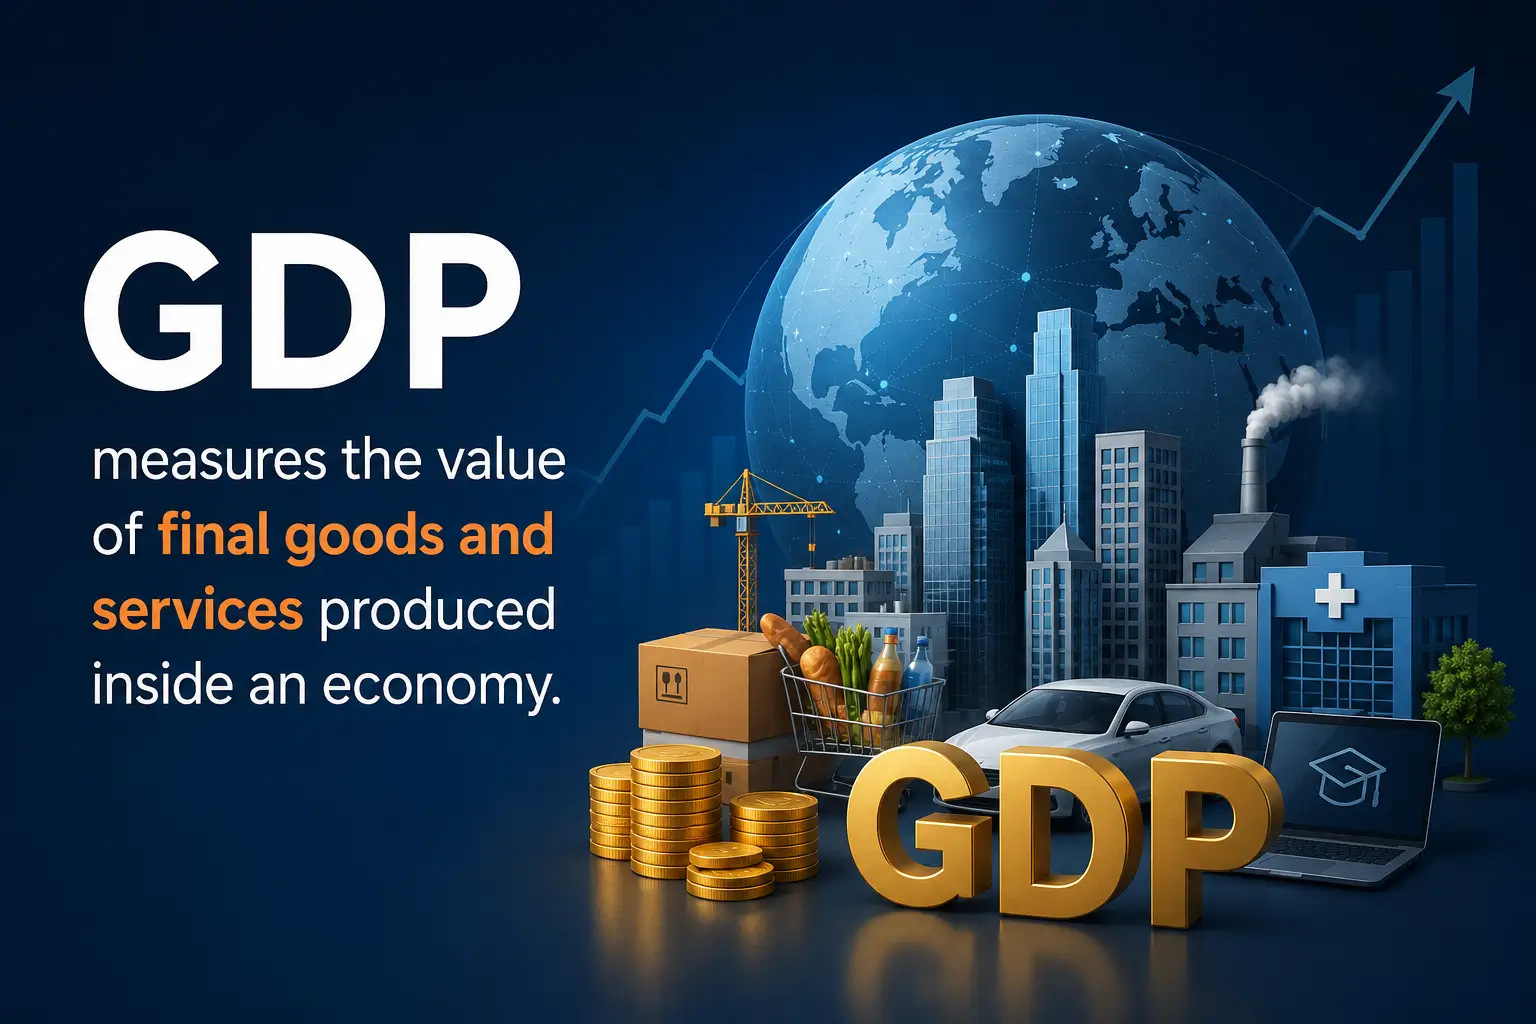
Gross domestic product (GDP) is the total market value of all final goods and services produced within a country over a specific period. It is one of the most widely used measures of economic activity, helping economists, governments, central banks, businesses and investors assess the size and health of an economy. While GDP does not measure living standards or income distribution, it remains a key indicator of whether an economy is expanding or contracting.
For financial markets, GDP is especially important because it can influence expectations for interest rates, currencies, bonds, stocks and commodities. Markets typically react not just to the GDP figure itself, but to whether it beats or misses forecasts, whether previous data is revised, and what it suggests about future central bank policy.
GDP simple definition
GDP is the market value of all final goods and services produced inside a country over a set period, usually a quarter or a year. “Gross” means the measure is taken before subtracting depreciation, which is the wear and tear on machinery, buildings and other capital. “Domestic” means the production happens within the country’s borders. “Product” refers to the goods and services created by that economic activity.
A simple example helps. If a bakery sells a loaf of bread to a customer, that sale contributes to GDP because it is a final good sold in the market. If the bakery buys flour from a mill, the flour is an intermediate good. It helps produce the bread, but counting both the flour and the final loaf separately would double count part of the same production process. GDP tries to count the final value, not every transaction along the way.
What GDP measures and what it excludes
GDP measures market production that includes final goods and services, some government-provided nonmarket services such as public education and defense, and output produced within national borders whether the producer is locally or foreign owned. This is why a foreign-owned car factory located in the United States contributes to US GDP. The production takes place inside the country.
GDP excludes many activities that still have real value. Unpaid care work, household labor, volunteer activity and much informal activity are not fully captured because no clear market price is recorded. If someone pays a childcare provider, that service counts. If a family member provides the same care unpaid at home, it usually does not appear directly in GDP. That does not mean the work has no value. It means GDP is built around measured market and official production.
GDP also does not show how income is distributed. A country can have a large GDP while much of the income goes to a small part of the population. Nor does GDP subtract environmental costs in a full social sense. Cutting down a forest can add to GDP through timber sales, even if the long-term environmental loss is severe. This is why GDP should be read as an output measure, not as a complete scorecard for well-being.
Modern economies add another complication: digital goods and free services. People use search engines, open-source software, social platforms, messaging apps and online information that may create large benefits at little or no direct price. Traditional GDP can struggle to measure that value because GDP depends heavily on market prices. So, GDP is powerful, but it has blind spots.
Why GDP matters
GDP matters because it gives a broad view of economic momentum. When real GDP rises, the economy is usually producing more goods and services after adjusting for inflation. That often lines up with stronger demand, higher business activity and improving employment. When real GDP shrinks, it can suggest weaker spending, falling output and rising recession risk.
Governments use GDP to assess tax revenue, public spending capacity and policy needs. Businesses use GDP trends to judge demand and expansion opportunities. Central banks watch GDP alongside inflation and labor market data because growth affects monetary policy. If growth is strong and inflation is high, a central bank may be less willing to cut interest rates. If growth is weak and inflation is falling, policymakers may become more supportive. For a deeper trading-focused view, see how central bank decisions can affect trading strategy.
Investors and traders care because GDP can shift expectations. A stronger-than-expected GDP release may support a country’s currency if traders believe it raises the chance of higher interest rates. It may also support equities if growth improves earnings expectations. But markets are rarely that neat. If strong GDP also means rates may stay higher for longer, stock indices can react negatively. Context matters, which is why GDP should be read with inflation, employment, central bank communication and market positioning.
How GDP is calculated
GDP can be calculated in three main ways: the expenditure approach, the production approach and the income approach. In theory, all three describe the same economy from different angles. One looks at what was spent, another looks at what was produced, and the third looks at what income was earned from production.
In practice, the numbers may differ slightly because national statistical offices rely on surveys, tax records, business reports, trade data and other sources that arrive at different times. GDP is a massive estimate, not a perfect live meter. That is why GDP figures are often revised after the first release.
Expenditure approach: spending in the economy
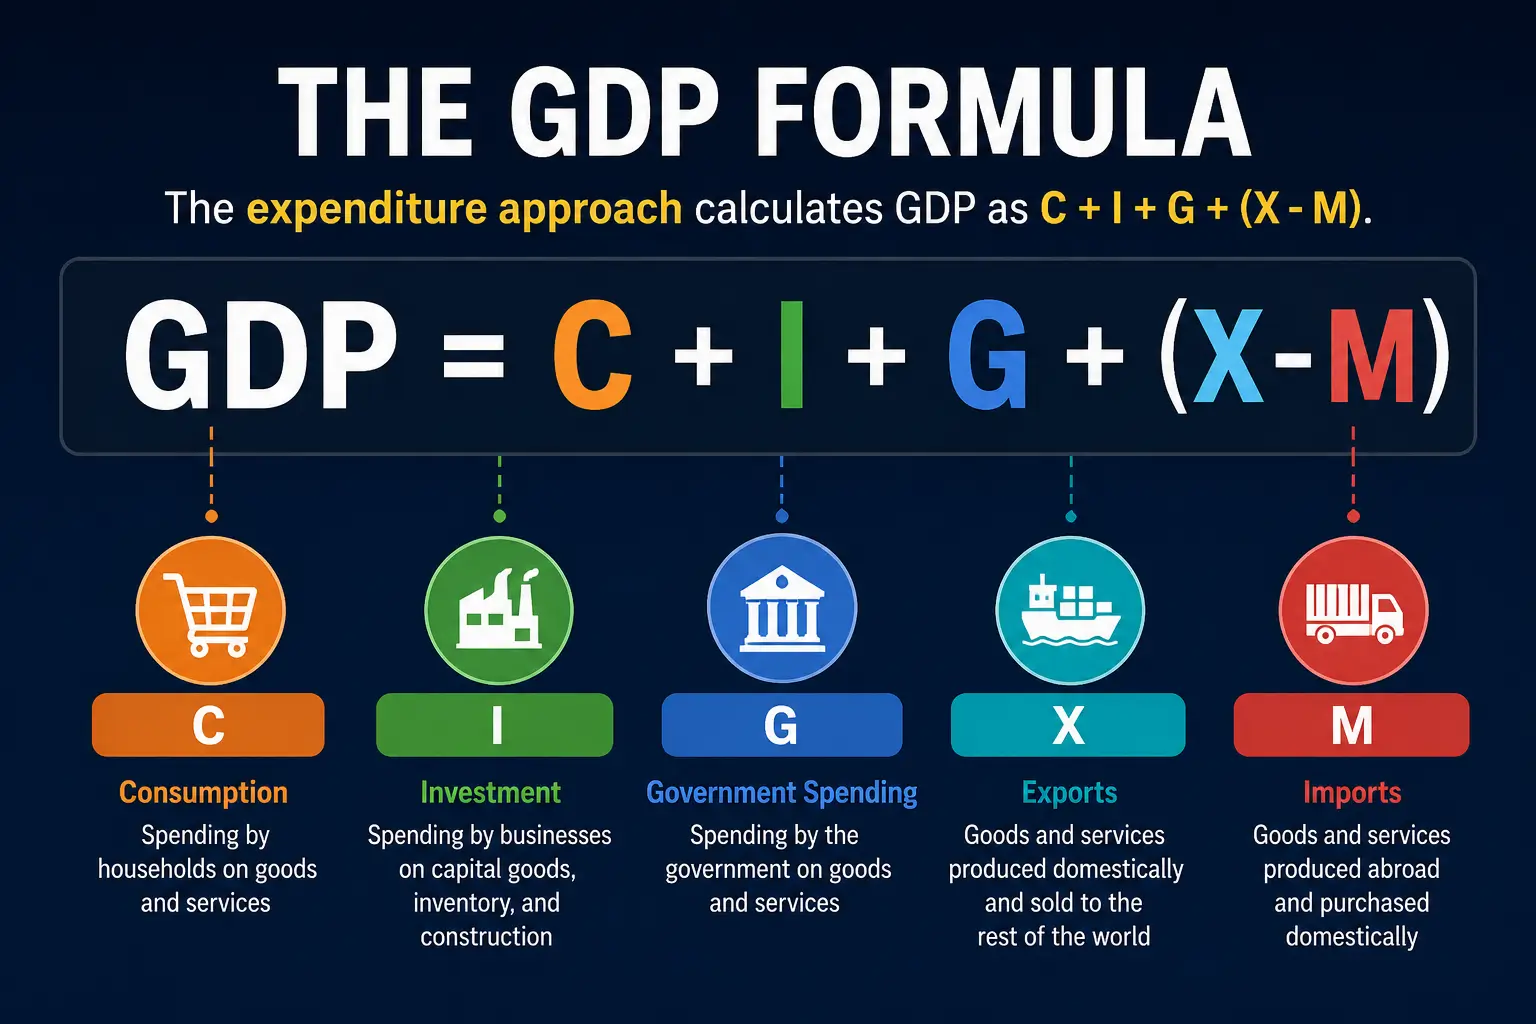
The expenditure approach is the formula most people see first:
GDP = C + I + G + (X – M)
In this formula, C means consumption, I means investment, G means government spending, X means exports, and M means imports. Exports minus imports are called net exports. Imports are subtracted because they are produced abroad, even if domestic consumers buy them.
| Component | Meaning | Simple example |
| Consumption | Household spending on goods and services | Food, rent, transport, medical care, retail purchases |
| Investment | Business capital spending, inventories and residential investment | Machinery, factories, software systems, new homes |
| Government spending | Public spending on goods and services | Infrastructure, defense, public education, public-sector wages |
| Net exports | Exports minus imports | A country sells cars abroad and imports electronics |
Imagine a small economy with household consumption of 500, investment of 150, government spending of 200, exports of 80 and imports of 100. GDP would be 500 + 150 + 200 + (80 – 100), which equals 830. This simple example does not capture every real-world detail, but it shows the logic clearly.
Production approach: value added at each stage
The production approach measures the value added by each industry or production stage. Value added means output minus the cost of intermediate inputs. This method is useful because it avoids double counting.
Think of wheat becoming flour and flour becoming bread. If GDP counted the full sale value at every stage, it would count the same underlying production more than once. The production approach counts the additional value created at each stage. The farmer adds value by producing wheat, the mill adds value by turning wheat into flour, and the bakery adds value by turning flour into bread for the final customer.
This approach is especially useful for sector analysis. It lets economists see how much manufacturing, construction, finance, healthcare, agriculture or technology contributes to economic output. If a country wants to understand which industries are driving growth, the production approach is often the most revealing.
Income approach: income earned from production
The income approach measures GDP by adding up the income generated by production. This includes wages paid to employees, business profits, rents, interest and taxes less subsidies. The basic idea is simple: when goods and services are produced, someone earns income from that production.
This approach helps connect GDP to households and businesses. A growing economy may produce higher wages, stronger company profits and better tax receipts, although those benefits are not always evenly shared. That is why the income approach is useful, but still incomplete as a measure of living standards.

Nominal GDP vs real GDP
Nominal GDP measures economic output using current prices. If prices rise sharply, nominal GDP can rise even when the economy is not producing much more in real terms. That is why nominal GDP is useful for measuring an economy’s current market size but less useful for comparing output over time.
Real GDP adjusts for inflation. It tries to answer a better growth question: did the economy produce more goods and services, or did prices simply go up? If a country sells the same amount of goods as last year but prices rise by 10 percent, nominal GDP may rise. Real GDP would show that actual output did not improve much, if at all.
The adjustment is often done with a GDP deflator, which is a broad price measure used to convert nominal GDP into real GDP. This is related to inflation, but it is not exactly the same as the Consumer Price Index. CPI tracks the prices paid by consumers for a basket of goods and services. The GDP deflator covers a broader set of domestically produced output. To understand how inflation data can affect currencies and markets, see this guide to CPI and forex.
GDP per capita, PPP GDP and growth rate
GDP has several variations because different questions require different measurements. The biggest economy is not always the richest on a per-person basis. The fastest-growing economy is not always the largest. A country may look bigger under one exchange-rate method and smaller under another.
| GDP measure | What it answers | Best used for | Main caution |
| Nominal GDP | How large is the economy at current prices and exchange rates? | Market size and global ranking | Affected by inflation and exchange rates |
| Real GDP | Is actual output growing after inflation? | Economic growth over time | Depends on base year and price adjustment method |
| GDP per capita | How much output is produced per person? | Rough living-standard comparison | Does not show inequality |
| PPP GDP | How large is the economy after adjusting for purchasing power? | International comparison of living costs and output | Less directly tied to market exchange rates |
| GDP growth rate | How fast is the economy expanding or shrinking? | Business cycle analysis | Can be volatile and revised |
GDP per capita: output per person
GDP per capita divides total GDP by population. It is often used as a rough indicator of average economic output per person. If two countries have similar GDP, the one with the smaller population will usually have higher GDP per capita.
Still, GDP per capita is not the same as personal income. It does not show who receives the income, how wealth is distributed, or whether people have access to quality healthcare, education and housing. It is a useful comparison tool, not a complete social measure.
PPP GDP: purchasing power comparison
PPP stands for purchasing power parity. PPP GDP adjusts for differences in local price levels. A haircut, rent payment or restaurant meal may cost much less in one country than another, even after currency conversion. PPP tries to account for that.
This matters because nominal GDP uses market exchange rates, which can move for reasons unrelated to local living costs. PPP is often more useful when comparing living standards or real domestic purchasing power. Nominal GDP is often more relevant for market size, global finance and currency-based comparisons. If exchange rates are part of your analysis, this guide to exchange-rate factors in the forex market adds useful context.
GDP growth rate: speed and direction
GDP growth rate measures the percentage change in GDP over time, usually real GDP. Positive growth means output is rising. Negative growth means output is shrinking. Two consecutive quarters of negative GDP growth are often used as a shorthand for recession, although some countries and institutions use broader recession definitions.
Growth rate matters because markets are forward-looking. A country with a smaller GDP but faster growth may attract attention from investors. A large economy with slowing growth may raise concerns about earnings, employment and policy support.
GDP by country: which economies are largest?
Country rankings depend on the metric used. Nominal GDP, real GDP, PPP GDP, GDP per capita and GDP growth can all produce different lists. If someone asks, “Which country has the highest GDP?” the first follow-up should be: Which GDP measure?

For nominal GDP in current US dollars, Worldometer’s GDP by country page, citing the IMF World Economic Outlook April 2026 projections, lists the United States as the largest economy, followed by China. The same table places Germany, Japan, the United Kingdom and India next. These figures are projections and should be refreshed before publication if the article is updated later.
| Rank | Country | Nominal GDP, 2026 projection | GDP growth | GDP per capita |
| 1 | United States | $32.38 trillion | 2.32% | $94,430 |
| 2 | China | $20.85 trillion | 4.41% | $14,874 |
| 3 | Germany | $5.45 trillion | 0.79% | $65,303 |
| 4 | Japan | $4.38 trillion | 0.72% | $35,703 |
| 5 | United Kingdom | $4.26 trillion | 0.80% | $61,056 |
| 6 | India | $4.15 trillion | 6.48% | $2,813 |
| 7 | France | $3.60 trillion | 0.86% | $52,083 |
| 8 | Italy | $2.74 trillion | 0.52% | $46,505 |
| 9 | Russia | $2.66 trillion | 1.09% | $18,525 |
| 10 | Brazil | $2.64 trillion | 1.91% | $12,313 |
Source note: figures above are from Worldometer’s GDP by Country page, which cites IMF April 2026 projections for nominal GDP. The table uses current US dollars and is not adjusted for inflation or cost-of-living differences.
The lowest GDP country in that same Worldometer table is Tuvalu, listed at $56 million with 3.08 percent growth and GDP per capita of $5,729. That answer should not be treated as timeless. Small economies and territories can move in and out of rankings depending on source coverage, exchange rates, revisions and whether the table includes sovereign states only or also territories.
Fastest-growing GDP is even more changeable. In the same Worldometer table, Guyana appears among the fastest-growing examples, with a very high projected growth rate. But growth rankings can swing dramatically for smaller economies, commodity-driven economies or countries recovering from shocks.
What happens when GDP is high or rising?
When real GDP is high or rising, it often signals a stronger economy. Consumers may be spending more, businesses may be investing, production may be increasing, and employment may be improving. A healthy GDP growth rate can encourage confidence among businesses and investors.
But high GDP is not automatically good in every situation. If GDP rises mostly because prices are rising, real output may not be improving. If growth is fueled by unsustainable borrowing, it may create problems later. If growth is strong while inflation is also too high, central banks may keep interest rates elevated. That can change how currencies, bonds and equities respond.
For markets, the important question is often whether GDP is stronger or weaker than expected. Suppose traders expect annualised GDP growth of 1.5 percent, but the actual figure comes in at 2.8 percent. That surprise may push bond yields higher if investors believe the central bank will stay restrictive. It may support the currency if higher yields attract capital. Yet it may pressure stock indices if investors worry that rates will not fall soon. This is why GDP data should be interpreted in the context of the broader macro picture.
Is higher GDP always better?
Higher real GDP is generally a positive sign because it means an economy is producing more after adjusting for inflation. More output can support jobs, wages, public revenue and business profits. It can also give governments more room to fund public services.
Still, higher GDP is not always better in a deeper social sense. GDP does not show whether the benefits of growth are widely shared. It does not tell whether people are healthier, less stressed or more financially secure. It does not automatically account for environmental damage, unpaid labor, the quality of public services or the sustainability of growth.
A country could increase GDP by rebuilding after a disaster, treating pollution-related illness or spending heavily on security after social unrest. Those activities involve market production, so they can add to GDP. But they do not necessarily mean life is better. This is the heart of the GDP limitation: it measures output, not everything that matters.
That does not make GDP useless. It means GDP should be paired with other indicators, such as inflation, unemployment, wages, productivity, income distribution, debt levels, environmental indicators and well-being measures.

GDP, recessions and business cycles
GDP helps describe the business cycle. Economies go through phases of expansion, peak, slowdown, contraction and recovery. Real GDP growth is one of the main indicators used to identify those shifts.
A recession is often described as two consecutive quarters of falling real GDP. That rule is useful, but it is not universal. Some institutions use a broader definition that also considers employment, income, industrial production and retail sales. The practical point is the same: a sustained contraction in GDP usually signals that the economy is under pressure.
For traders, recession risk can change market behaviour quickly. Weak GDP growth may weigh on a country’s currency if it heightens expectations of rate cuts. It may hurt equities if investors expect lower earnings. It can also support government bonds if investors seek safety or anticipate lower rates. During severe downturns, macro relationships can become messy because fear, liquidity and policy intervention all matter.
Historical crisis content can help put GDP contractions in perspective. The 2008 financial crisis, the 1997 economic crisis and the Great Depression all show how output, credit, employment and confidence can interact during major downturns.
How GDP releases affect forex, indices, bonds and commodities
GDP releases affect markets because they can change expectations about growth, inflation and interest rates. Traders usually compare the actual release with the forecast and the previous reading. A small miss may not matter much if markets were already prepared. A large surprise can create volatility.
Forex markets
Currencies often respond to GDP through the interest-rate channel. Stronger-than-expected growth may support a currency if traders believe the central bank will keep rates higher for longer or delay rate cuts. Weaker-than-expected growth may pressure a currency if traders expect easier policy.
The US dollar is a good example because it sits at the center of global markets. Strong US GDP can support the dollar when Treasury yields rise or when expectations for the Federal Reserve shift. But if risk appetite rises at the same time, some higher-beta currencies may also benefit. To connect GDP with broader dollar drivers, see these factors that affect the US dollar rate.
Bond yields
Bond yields often rise when GDP is stronger than expected, especially if inflation is also high. Investors may price in tighter monetary policy or stronger demand for capital. If GDP is weak, yields may fall as markets anticipate slower growth or rate cuts.
If GDP is weak but inflation remains high, central banks may still hesitate to cut rates. If GDP is strong but inflation is falling, yields may not rise much. This is why GDP should be read alongside inflation, employment and central bank speeches. For more on this, see how bond yields can affect forex, stocks, gold and oil.
Stock indices
Equity markets can read GDP in two different ways. Strong GDP may support corporate earnings, consumer demand and business confidence. But if strong growth raises the chance of higher interest rates, equities may react negatively because future earnings are discounted at a higher rate.
Weak GDP can also cut both ways. It may hurt earnings expectations, but it may also increase hopes for rate cuts or policy support. This is why traders often look beyond the headline figure and ask what the data means for central banks and sectors. If you trade indices, this guide on what indices are can help connect macro data to index markets.
Commodities
GDP affects commodities through demand expectations. Stronger global growth may support demand for oil, industrial metals and some agricultural commodities. Slower growth may reduce demand expectations and pressure cyclical commodities.
Gold can behave differently. It may rise when weak GDP increases recession fears or when lower rate expectations reduce the opportunity cost of holding gold. But it may fall if strong GDP pushes yields and the dollar higher. Again, context does the heavy lifting.
How to read GDP on an economic calendar
A GDP entry on an economic calendar usually includes the country, the reporting period, the previous figure, the forecast, the actual figure and sometimes the revised previous number. The actual number is important, but the surprise is often more important. Markets move when expectations change.
Here is a simple way to read it:
- Check the country and time of release.
- Identify whether the release is quarterly, annualized, year-on-year or month-on-month where applicable.
- Compare the forecast with the previous value.
- Compare the actual figure with the forecast.
- Look for revisions to previous GDP data.
- Read the number alongside inflation, employment and central bank expectations.
GDP releases may come in stages, such as advance, preliminary and final estimates. The first release often gets the most attention because it is new information. Later revisions can still matter, especially if they change the story about whether the economy was stronger or weaker than first reported.
If you use MetaTrader 4, the MT4 economic calendar can help you track data events inside a trading workflow. The goal is not to trade every release. It is important to know when volatility risk may increase and which markets may be sensitive.
GDP vs GNI, GNP, HDI and well-being
GDP is not the only economic measure. It is useful partly because it has clear boundaries, but those boundaries also limit it. Comparing GDP with related indicators helps prevent confusion.
| Indicator | What it measures | Useful distinction |
| GDP | Output produced within a country’s borders | Location-based production |
| GNI | Income earned by a country’s residents and businesses | Ownership or residency-based income |
| GNP | Output produced by a country’s residents or firms, regardless of location | Older related concept, closer to national ownership |
| HDI | Health, education and income indicators | Broader human development view |
| Well-being measures | Life satisfaction, health, environment, relationships and other social factors | Quality-of-life context beyond output |
GDP is location-based. If a foreign-owned company produces goods inside a country, that production counts in the host country’s GDP. GNI is more focused on income earned by residents and nationally owned entities, including income from abroad. This distinction matters for countries with large foreign investment flows, multinational profits or remittances.
HDI and well-being indicators answer different questions. They ask about health, education, quality of life and sustainability. A country can have a large GDP but weaker outcomes in some of these areas. A smaller economy can sometimes score well on human development because income is more evenly distributed or public services are strong.
Frequently Asked Questions About GDP
What are the four components of GDP?
The expenditure approach divides GDP into four components: consumption (C), investment (I), government spending (G), and net exports (X − M). Net exports are calculated by subtracting imports from exports.
Which country has the highest GDP?
Based on the IMF April 2026 projections reported by Worldometer, the United States has the world’s largest nominal GDP, followed by China. Rankings differ when measured using purchasing power parity (PPP) or GDP per capita.
What are the five largest economies by GDP?
According to the Worldometer 2026 nominal GDP rankings based on IMF April 2026 projections, the five largest economies are:
- United States
- China
- Germany
- Japan
- United Kingdom
India ranks sixth and is close to the United Kingdom in total nominal GDP.
Which countries have the fastest-growing GDP?
The fastest-growing economies vary from year to year. According to Worldometer’s 2026 GDP projections, Guyana is among the fastest-growing economies, although annual growth rankings change as economic conditions evolve.
Which country has the lowest GDP?
Based on the same Worldometer 2026 nominal GDP table, Tuvalu has the smallest economy, with a nominal GDP of approximately US$56 million. The answer may differ depending on the data source, reporting year and whether territories are included.
Sources
- https://www.imf.org/en/publications/fandd/issues/series/back-to-basics/gross-domestic-product-gdp
- https://databank.worldbank.org/metadataglossary/world-development-indicators/series/NY.GDP.MKTP.KD.ZG
- https://www.worldometers.info/gdp/gdp-by-country/